Inventory and supply chain

Act on it where you see it.

One store is about to run out of an item another store has too much of. This inventory dashboard shows both, and lets the planner fix it on the spot: log a transfer, cancel the rush order and leave a trail the whole team can follow.

Data
Retail inventory (demo)
Pages
Home and 7 topic pages
Positions
100 store and product pairs
Write-back
3 forms, 3 sheets, 1 editable table

From a rush order to a transfer

All eight pages

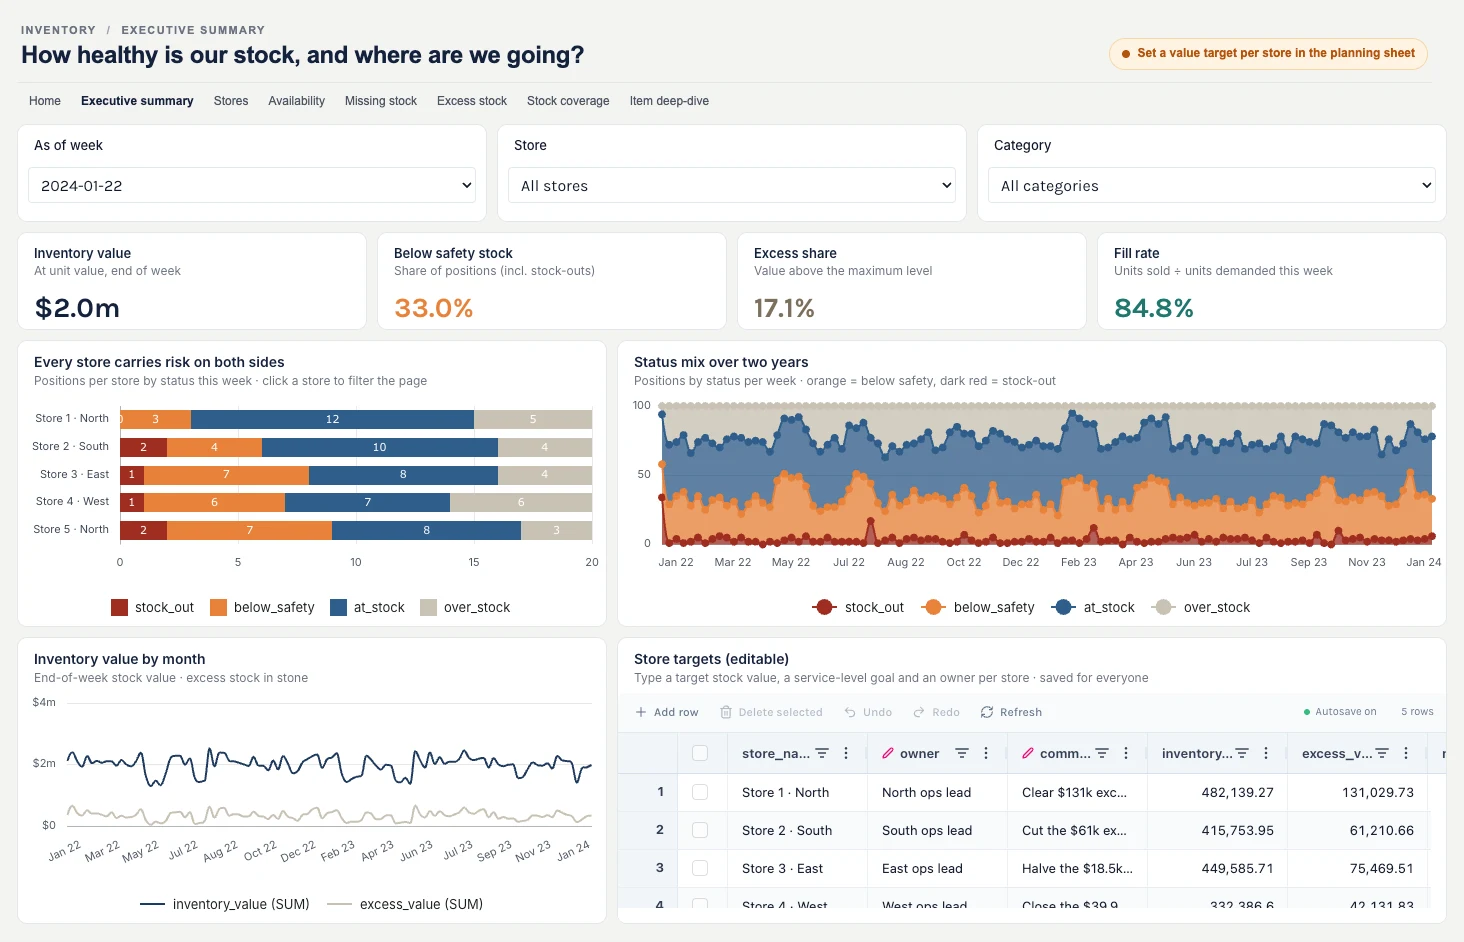
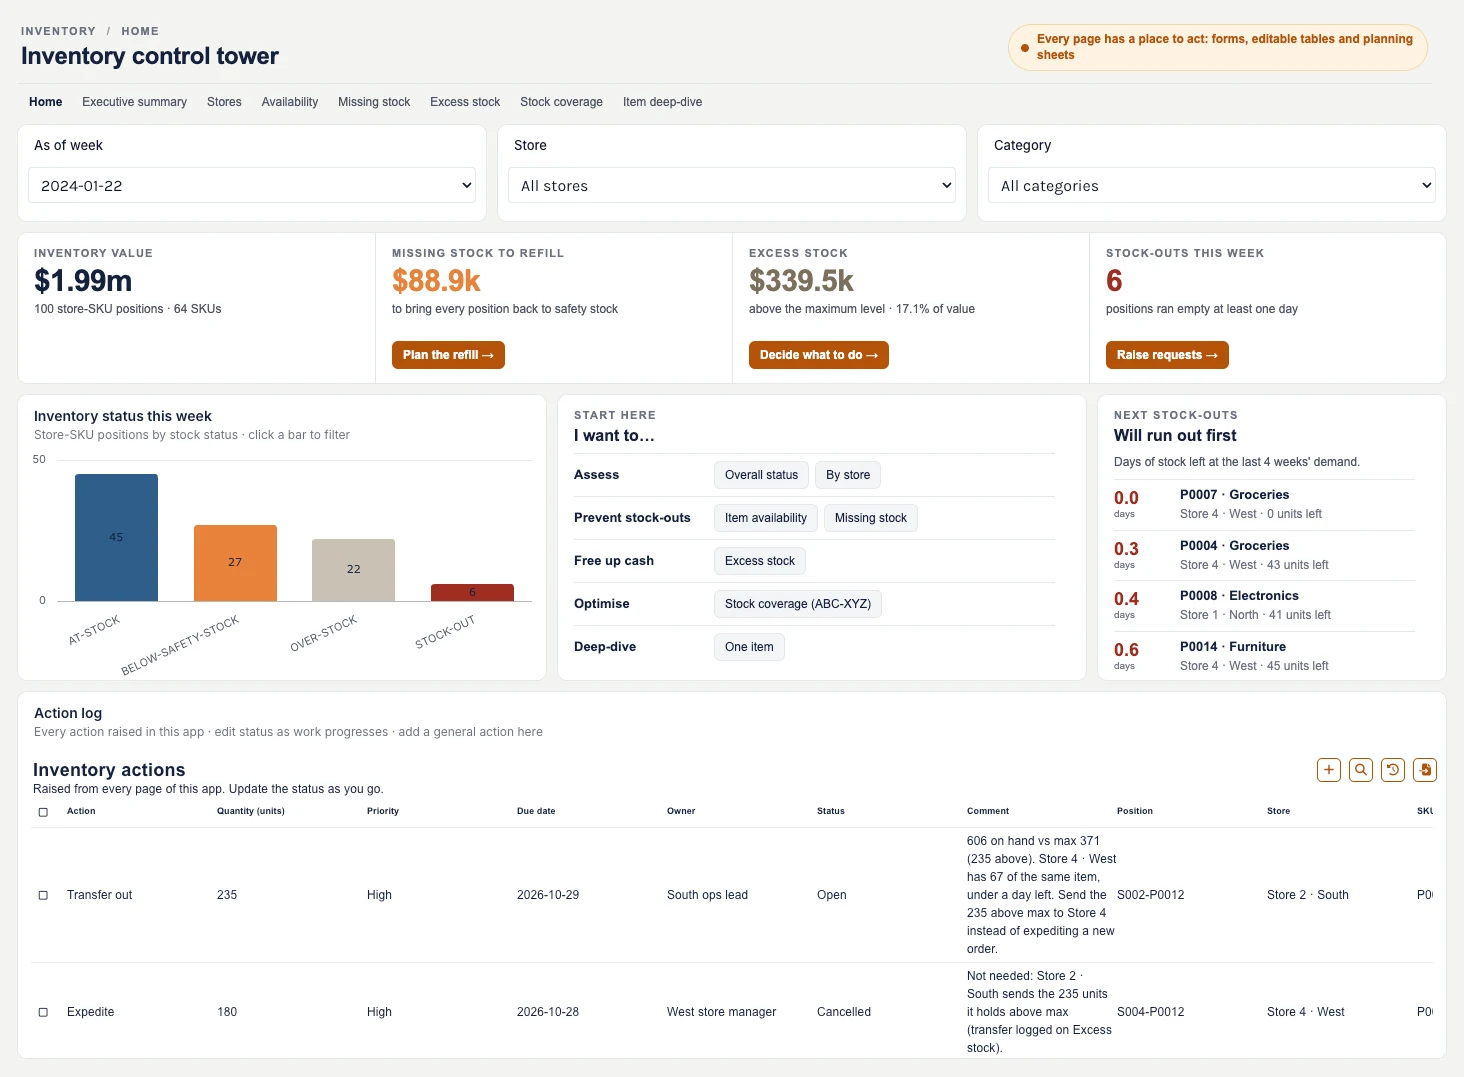
The full Home page: headline tiles, stock status chart, "I want to" menu, next stock-outs and the action log with the new transfer and the cancelled expedite request

Built in Trulyp Analytics on Retail inventory (demo data): 5 stores, 20 products, weekly positions, plus writeback tables. Click the screenshot to open it at full size.

The gap after the insight

Most dashboards stop at the insight.

Most dashboards stop at the insight. You spot a problem, then leave to fix it: an email to purchasing, a line in a spreadsheet, a call to a store. The decision lives somewhere else, and the next person who opens the dashboard has no idea it was made.

This inventory dashboard works the other way round. Every page ends in a place to act: a form, an editable table or a planning sheet. What you record is saved straight away, shared with everyone and collected in one action log on the Home page. Below is one example of what that changes, played out in the demo data.

  1. What runs out next?

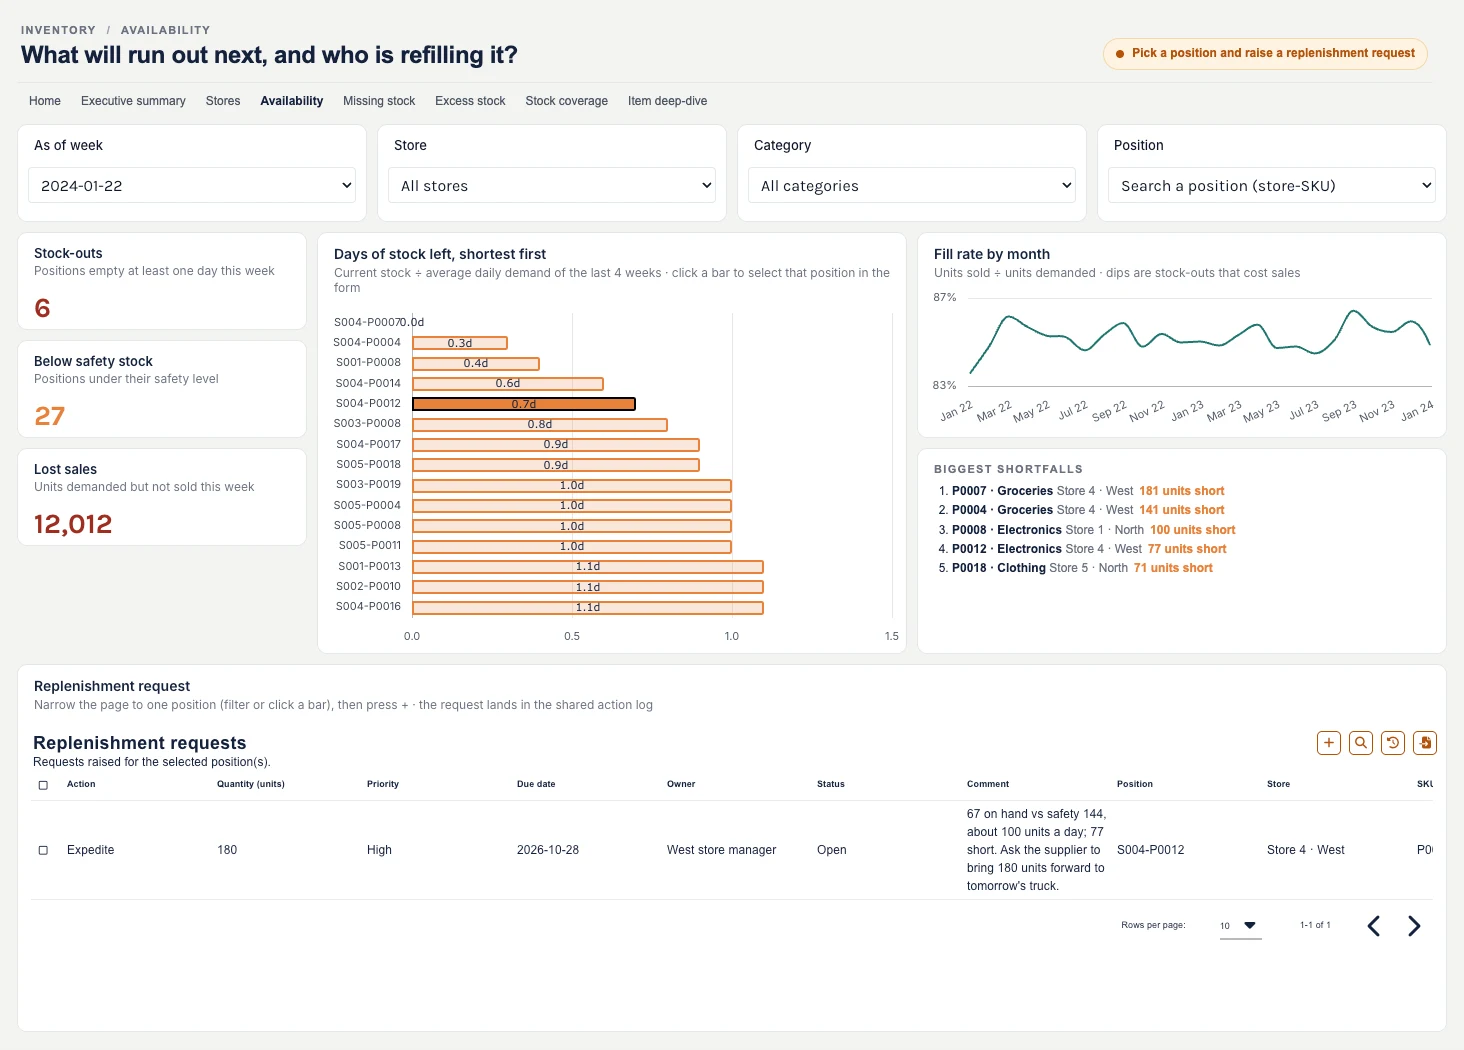
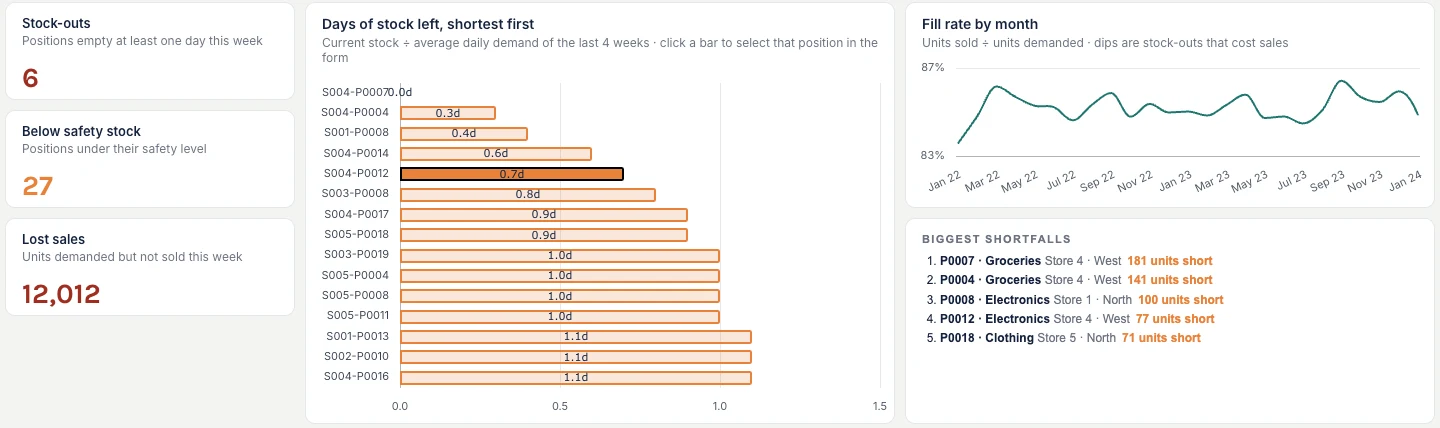
    Availability ranks every store and item by days of stock left, shortest first.

  2. Where is stock sitting idle?

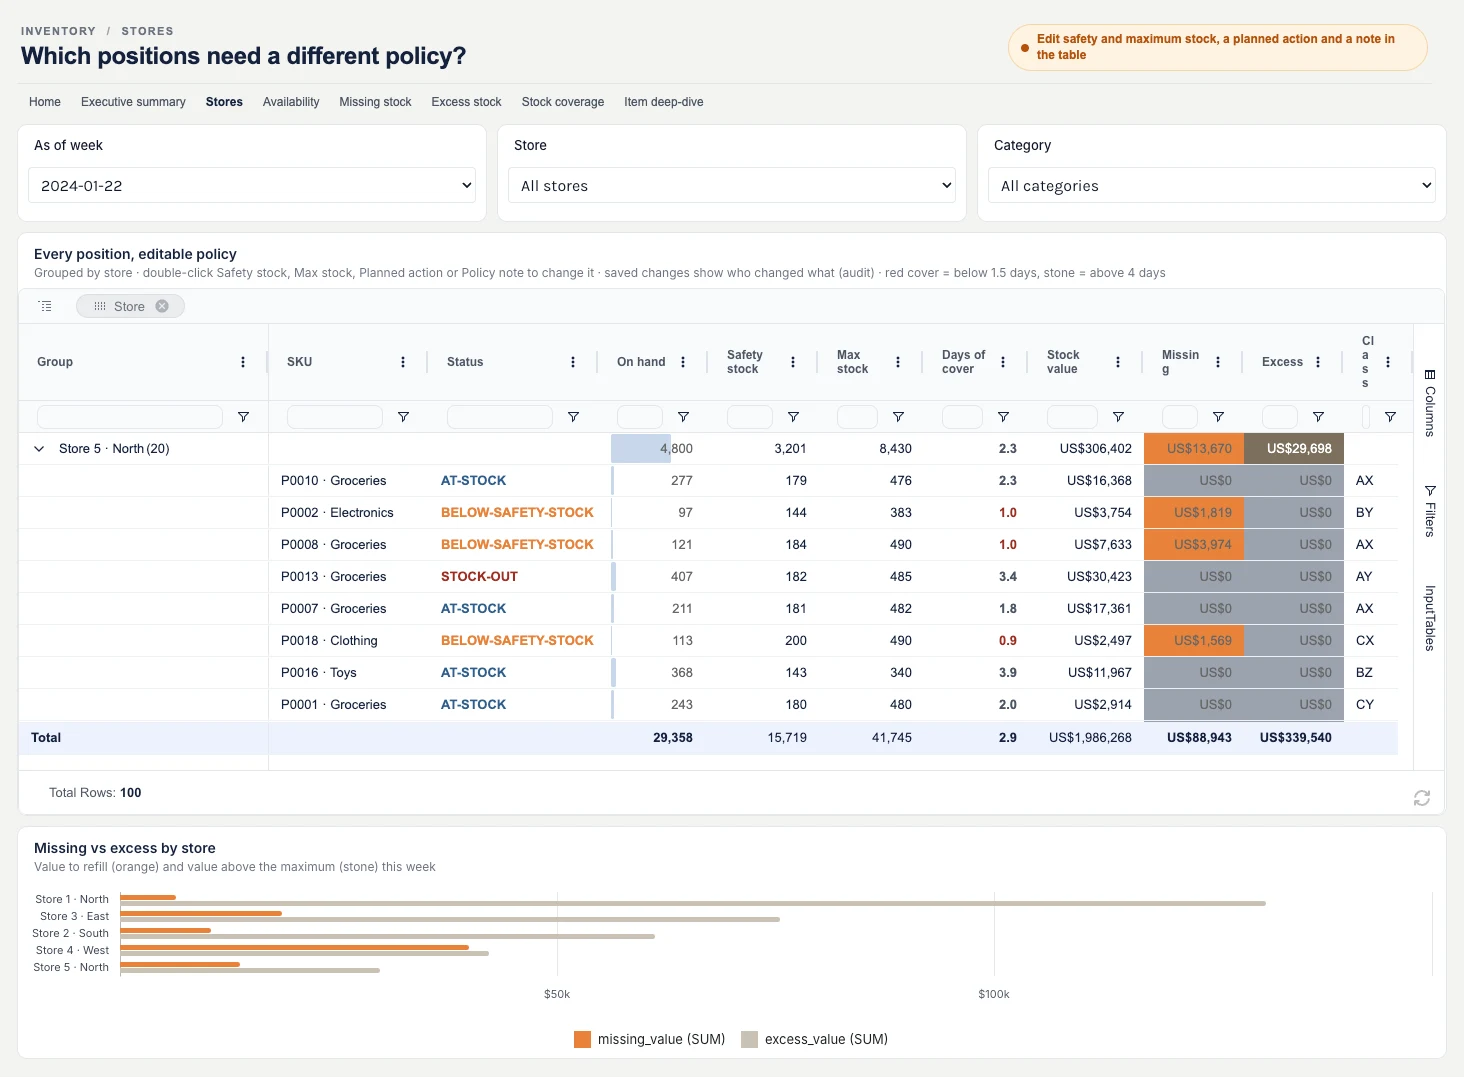
    Excess stock lists the store and item pairs with the most value above their maximum level.

  3. What has already been decided?

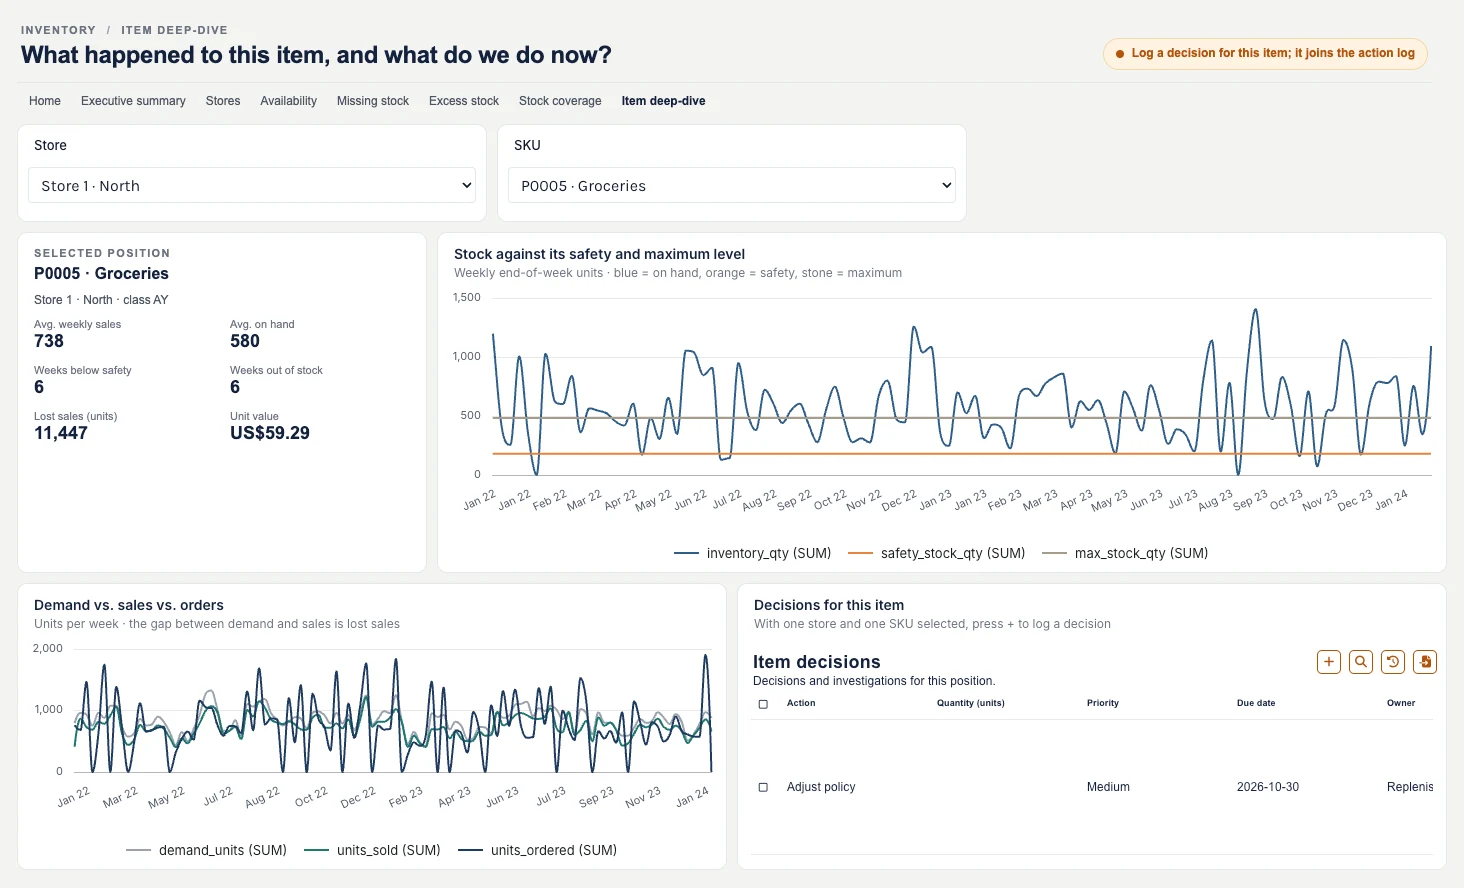
    Select an item and the form on the page lists the actions already logged for it.

  4. Who is doing what?

    The action log on Home collects every request and decision with its owner, due date and status.

What changes

The whole loop on one screen.

The transfer itself is ordinary. What matters is that noticing, deciding and recording all happened on the same screens.

  • 0.7 daysof stock left for P0012 at Store 4 West
  • 208units of that item demanded but not sold this week
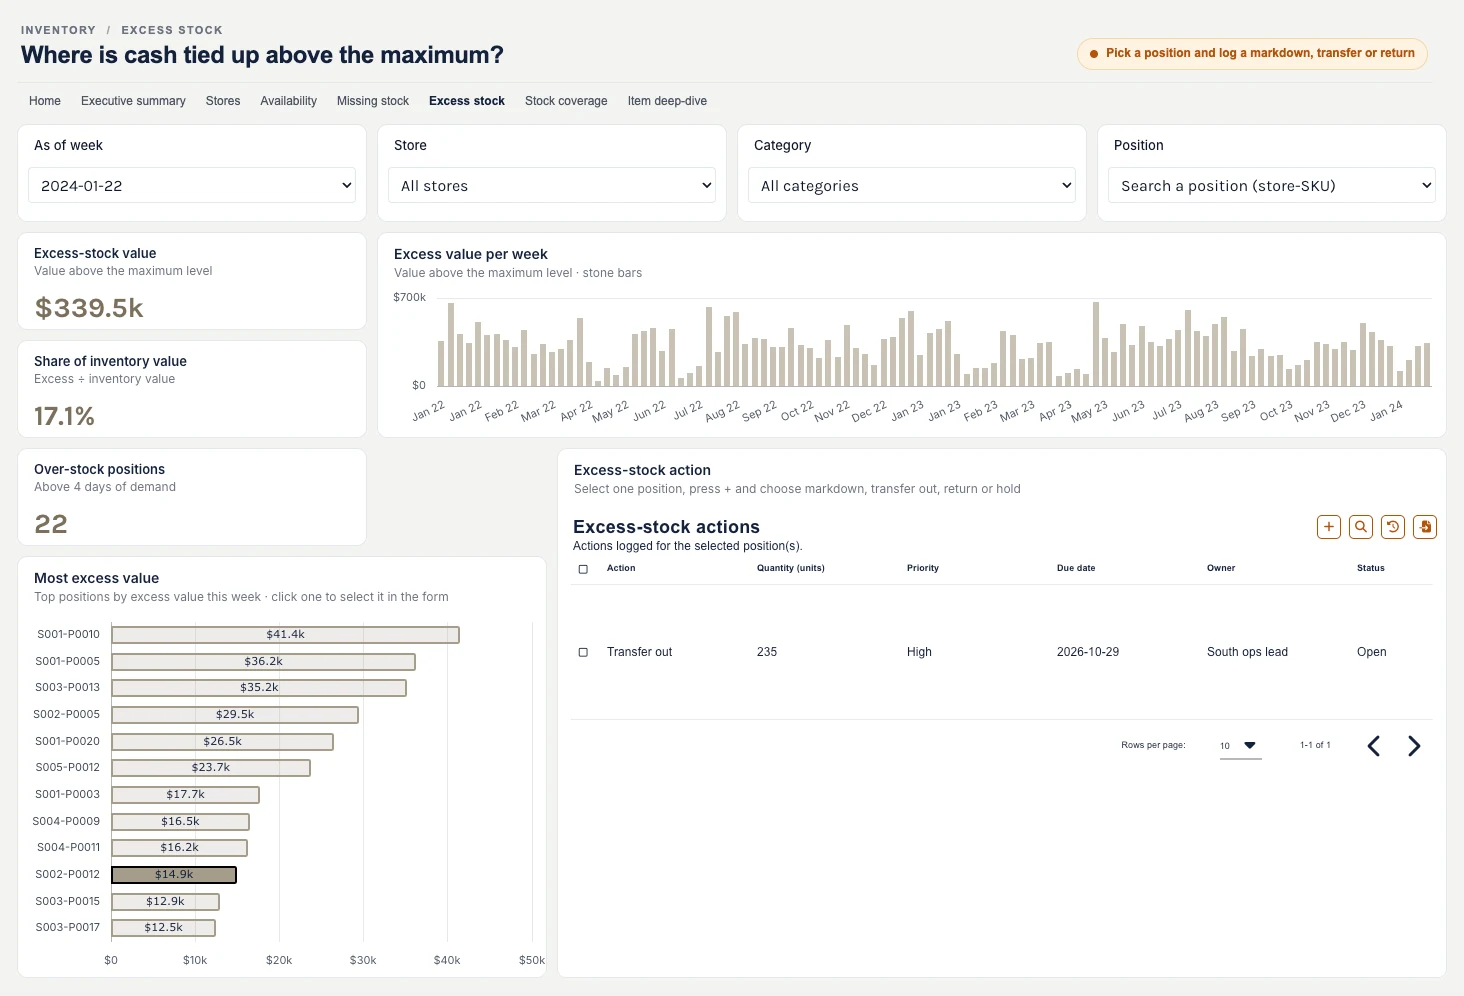
  • 235units of the same item above the maximum at Store 2 South
  • $339.5Kof stock above maximum levels across all stores
  • The right fix, not the first one

    A rush order was already on the table for Store 4. Because the surplus is one click away, the better option was easy to see: the same item, sitting above its maximum in Store 2.

  • Decisions recorded where they are made

    The transfer was logged on the page that showed the surplus. Clicking the bar filled in the store and item, so there was nothing to copy and no separate tracker to update.

  • One record for everyone

    The action log shows the transfer as Open and the rush order as Cancelled, each with a short reason. Anyone opening the dashboard sees what changed and why.

  • Room for every kind of input

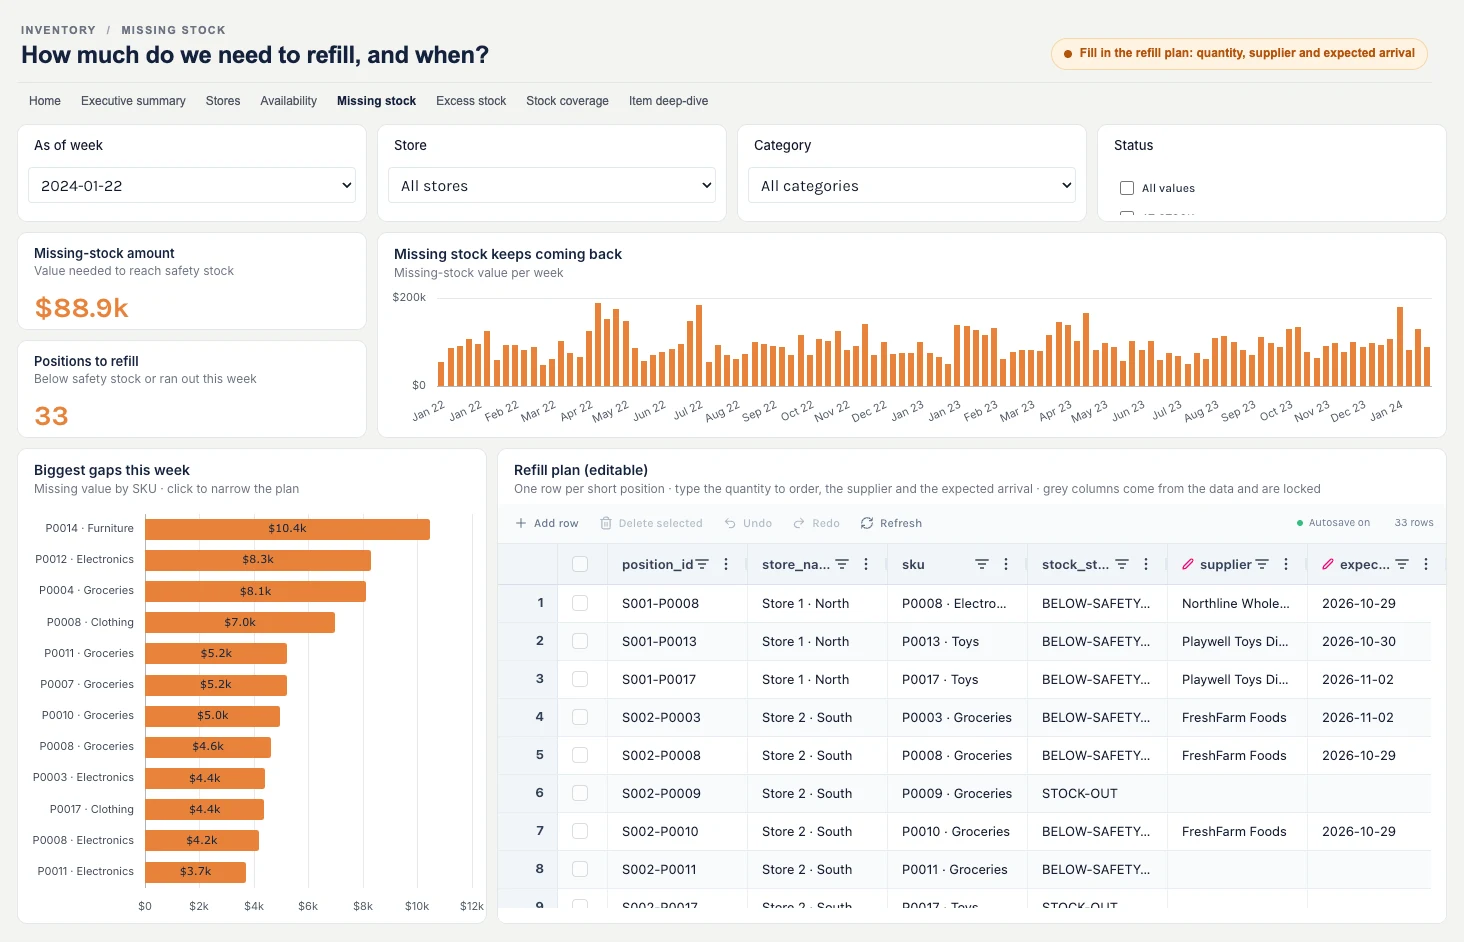
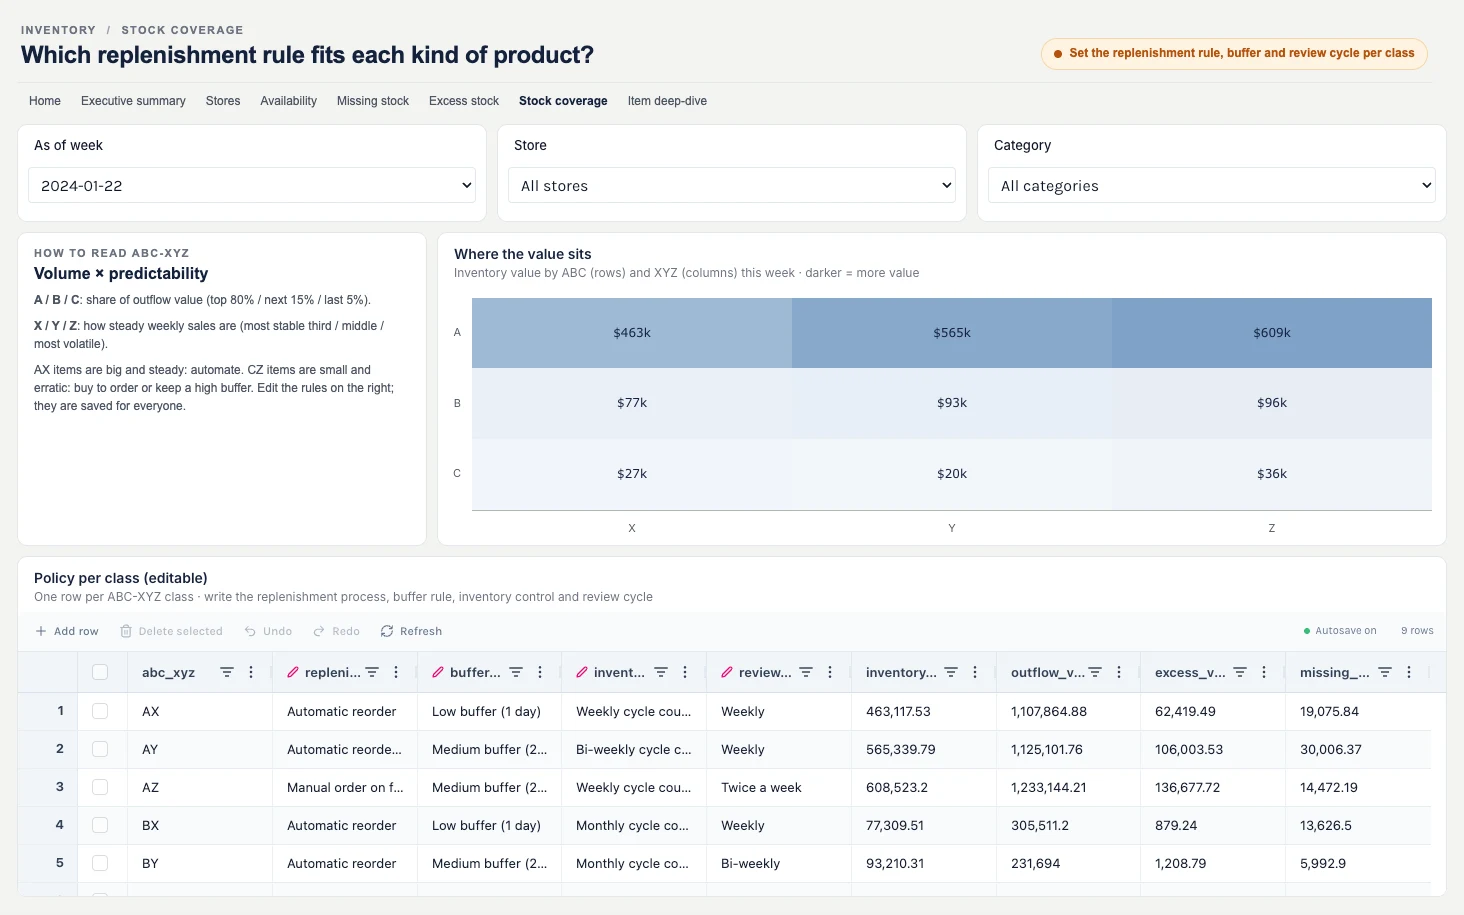
    Next to the forms, shared planning sheets hold the refill plan, store targets and the stock rules per product class. They save as you type.

One item, two stores

Short in one store, stuck in another.

One item, two stores, five steps. The requests and the transfer are a worked example entered in the demo; the stock figures come straight from the data.

01

Spot the item about to run out

Availability ranks every store and item by days of stock left. P0012 Electronics at Store 4 West has 67 units and sells about 100 a day: 0.7 days of cover, with 208 units of demand already missed this week.

  • Horizontal bar chart
  • HTML visual
Days of stock left per store and item, shortest first, with S004-P0012 selected at 0.7 days, next to the fill rate and the biggest shortfalls

02

See what was already decided

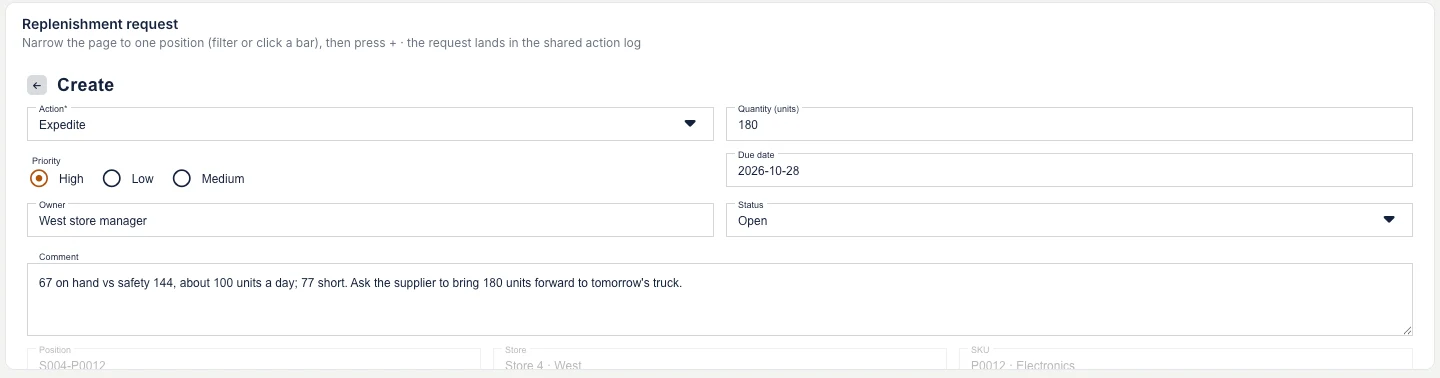
Clicking the bar selects that store and item, and the WriteBackExtreme form below it is where requests for it are logged. The West store manager has already raised one: expedite 180 units, high priority, due 28 October, with the reason in one line. A sensible move, but it means buying more stock.

  • WriteBackExtreme form
The WriteBackExtreme replenishment form for S004-P0012 filled in: Expedite, 180 units, high priority, due 2026-10-28, West store manager, Open, and the reason

03

Find the stock that is already there

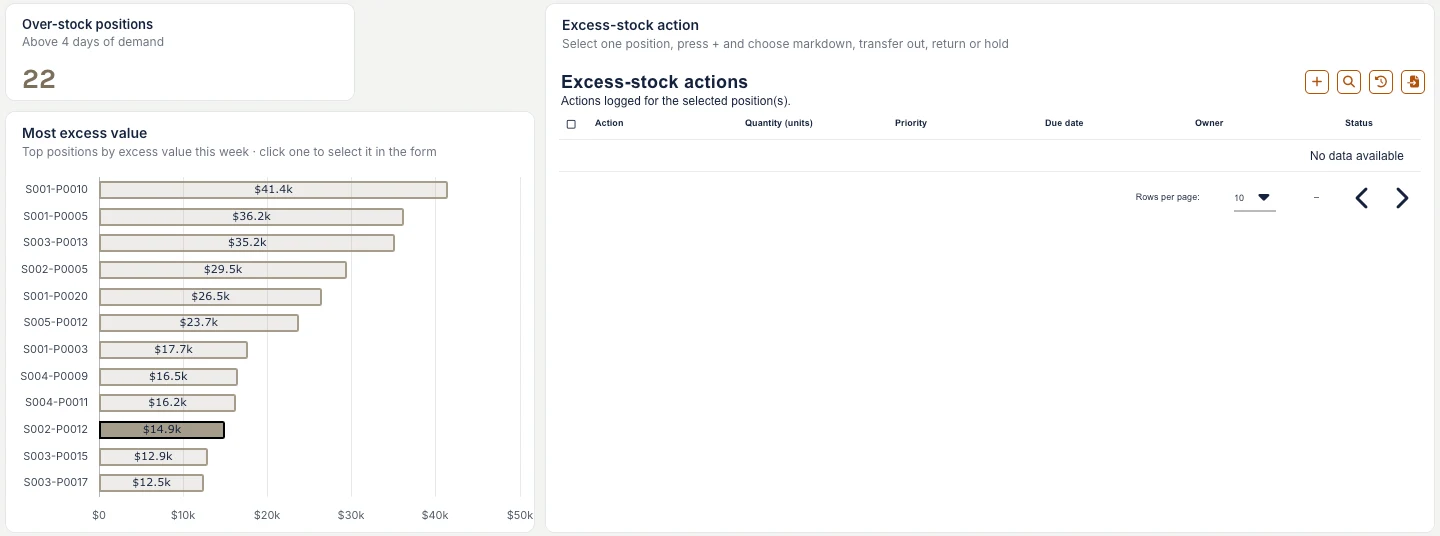
One click away, Excess stock shows where cash sits above the maximum level. Store 2 South holds 606 units of the same item against a maximum of 371. That is 235 units too many, while Store 4 is about to run dry.

  • Horizontal bar chart
The positions with the most excess value, with S002-P0012 selected, next to an empty list of excess-stock actions for it

04

Log the transfer on the spot

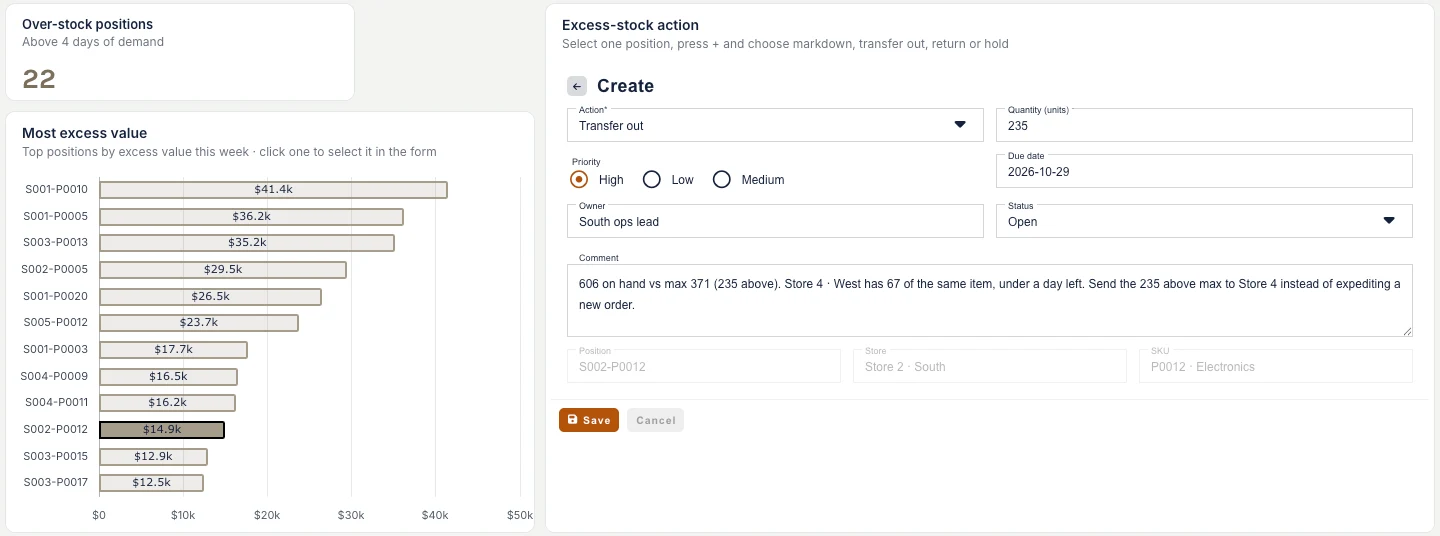
With Store 2 selected, press + and the form already knows the store and item. Choose Transfer out, 235 units, an owner and a due date, add a one-line reason and save. It is stored straight away and visible to the whole team.

  • WriteBackExtreme form
The excess-stock action form filled in: Transfer out, 235 units, high priority, due date, South ops lead and the reason, for S002-P0012

05

Close the loop in the action log

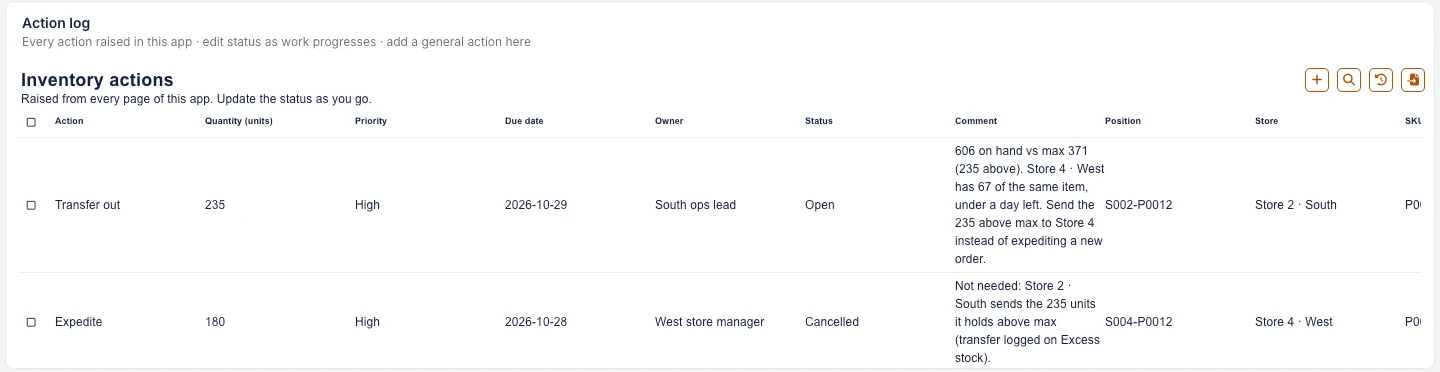
On Home, the action log now tells the whole story. The transfer is Open with its owner, and the rush order is set to Cancelled with the reason. Nobody has to ask what happened.

  • WriteBackExtreme form
The action log: Transfer out 235 units from S002-P0012, Open, and Expedite 180 units for S004-P0012, Cancelled, each with its comment

How it is wired

Every page ends in an input.

Standard Trulyp Analytics visuals on weekly inventory data, with writeback tables for every input.

  1. Load the stock positions

    Weekly stock per store and product with safety stock, maximum level, demand and unit value. Missing and excess value are the gaps to those two levels.

  2. Give each page one question

    An executive summary, stores, availability, missing stock, excess stock, stock coverage and a single item each get a page, linked from the Home page.

  3. Add one action table

    A single writeback table holds every request and decision, with a column for the page it came from. The forms on each page write to it, and the Home page reads it.

  4. Add the planning sheets

    Spreadsheet visuals with writeback for the refill plan, store targets and the policy per product class, saved for everyone as they type.

  5. Connect clicks to forms

    Clicking a bar selects that store and product, so the form opens with them filled in and lists what was already logged.

Act on your own stock.

Put the numbers and the next step on the same page, so decisions are recorded where they are made.